Designing Inclusive Dashboards
About this session
In this session you will learn how to create Power BI reports that everyone can use, ensuring a high-quality experience for all and embracing diversity. Accessibility is vital, as 24% of people in the UK have a disability, and inaccessible content can create barriers and isolate users. We'll cover making content accessible for those with colour vision deficiency, addressing the needs of neurodiverse individuals, enhancing accessibility for users with low vision and screen readers, considering the needs of people with mobility impairments, and supporting users with low literacy. Let's make our reports accessible to all and create a more inclusive experience!
Related sessions
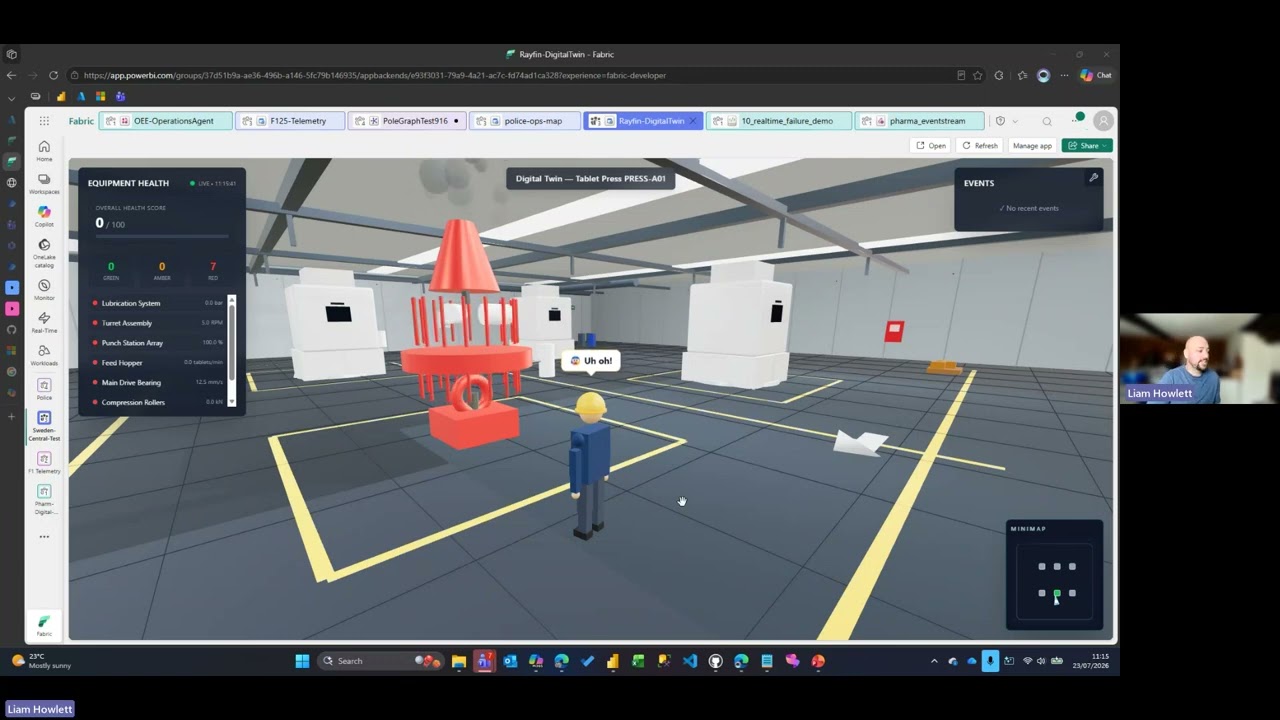
Apps That Speak Power BI: An Intro to Rayfin on Microsoft Fabric
Ever hit the ceiling of a standard Power BI visual and wished you could just build the exact experience in your head? Rayfin was one of the headline announcements at Build 2026, and it makes this far more achievable. It's an open-source SDK and CLI that lets you (or an AI coding agent alongside you) define a full app backend in code and deploy it straight onto Microsoft Fabric. The part that matters for this community: your app runs as a first-class Fabric artifact and its data lands directly in OneLake. The custom apps and front-ends you build sit right on top of the same governed data as your Power BI reports. No copies, no pipelines, no separate environment.
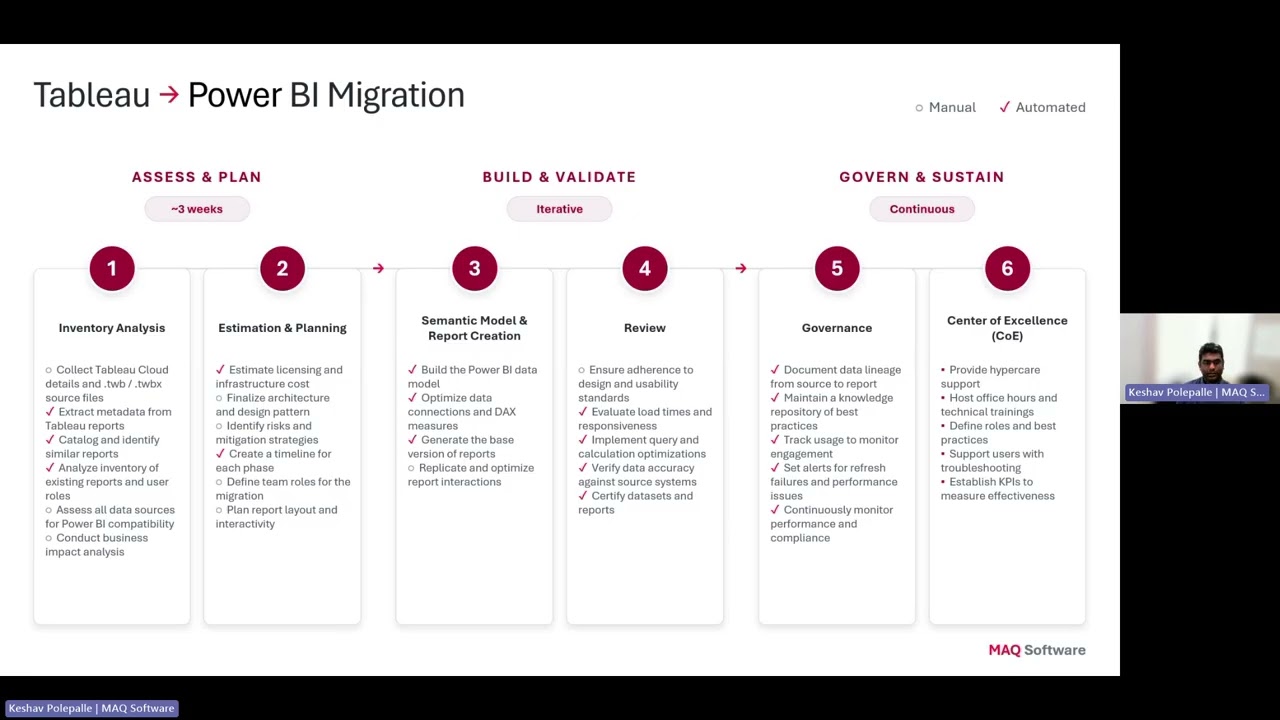
AI-Powered Migration: Tableau to Power BI & Alteryx to Fabric
Organizations are rapidly modernizing their analytics platforms, but traditional migration approaches from Tableau and Alteryx are slow, expensive, and heavily dependent on manual effort. Demonstrates how Agentic AI is transforming analytics modernization by accelerating Tableau → Power BI migrations and converting Alteryx workflows into Microsoft Fabric Data Pipelines and Dataflow Gen2.
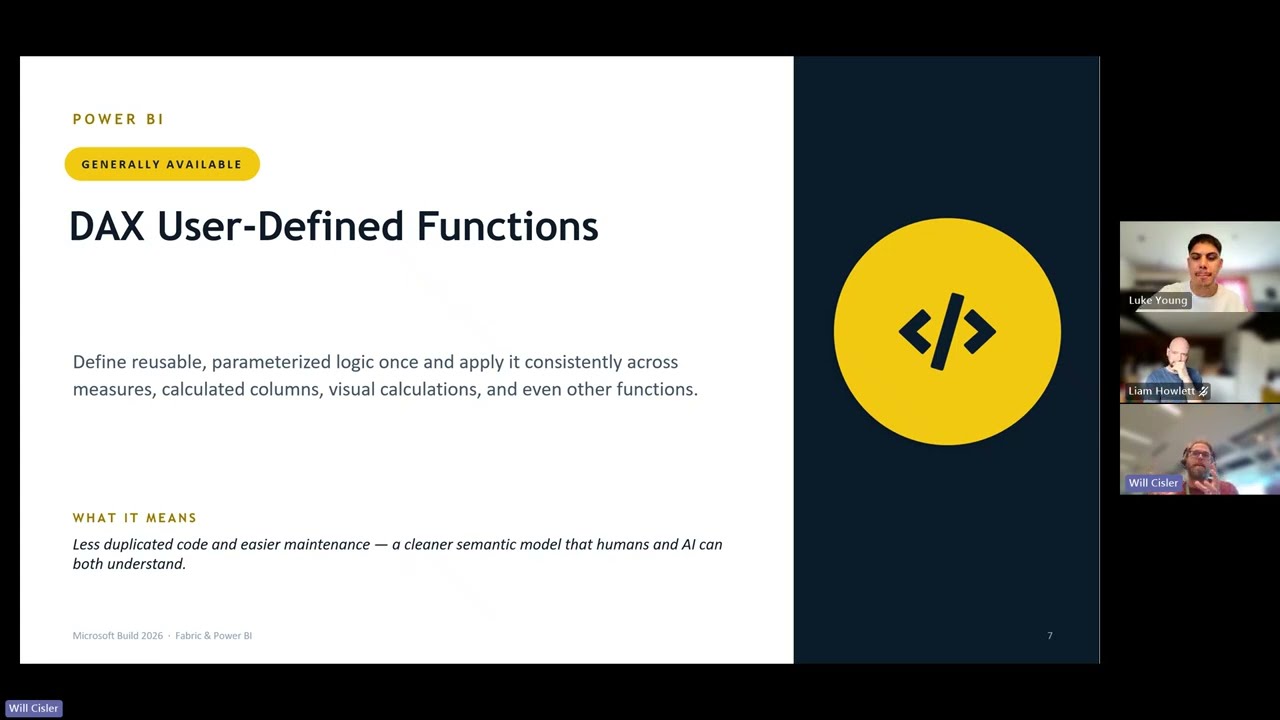
Microsoft Build 2026: The Announcements That Matter for Fabric and Power BI
Microsoft Build 2026 brought a wave of announcements across AI, data, developer tools and analytics - but what do they actually mean for Power BI and Microsoft Fabric users? In this session, we’ll cut through the noise and recap the key updates that matter most to the data community, including the latest around agentic analytics, Fabric, Power BI, semantic models, and AI-powered app development. Join us for a practical, easy-to-follow summary of the biggest Build announcements, what they unlock for organisations, and how they could shape the way teams build, govern and deliver insights going forward. Whether you missed Build entirely or just want the highlights without watching hours of sessions, this recap will help you understand what’s changed, why it matters, and where to focus next.